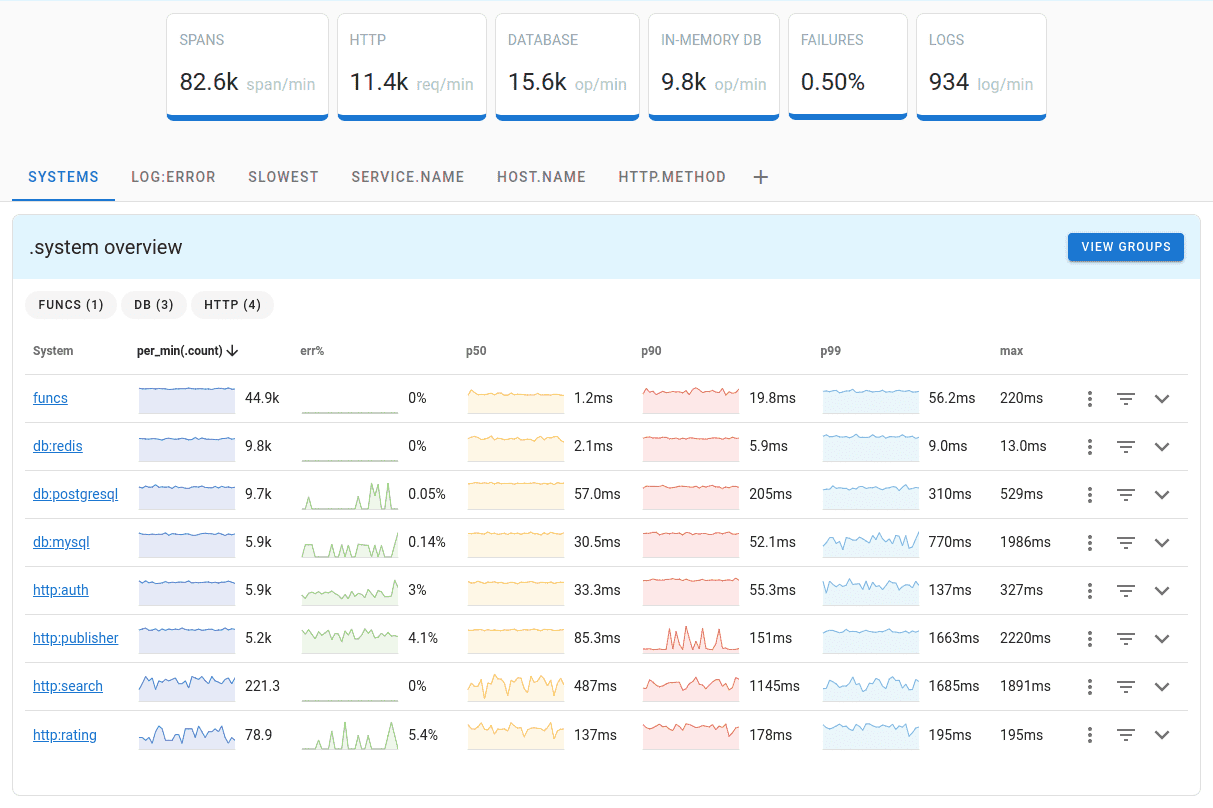
Monitoring Tasks Performance and Errors
What is OpenTelemetry?
taskq uses OpenTelemetry to monitor performance and errors using distributed tracing and metrics.
OpenTelemetry is a vendor-neutral standard that allows you to collect and export traces, logs, and metrics.
OpenTelemetry is available for most programming languages and allows to send performance data to any tracing tool of your choice.
OpenTelemetry instrumentation
First, you need to install taskqotel module:
go get github.com/vmihailenco/taskq/extra/taskqotel/v3
Then, install the hook provided by the module:
import "github.com/vmihailenco/taskq/extra/taskqotel/v3"

consumer := queue.Consumer()
consumer.AddHook(taskqotel.NewHook())
You can install the hook for all queues created by the factory like this:
factory.Range(func(q taskq.Queue) bool {
    consumer := q.Consumer()
    consumer.AddHook(taskqotel.NewHook())
    return true
})
Once hook is installed, just start the consumer as usually:
if err := consumer.Start(ctx); err != nil {
    panic(err)
}
Uptrace
Uptrace is an open source APM for OpenTelemetry that supports distributed tracing, metrics, and logs. You can use it to monitor applications and troubleshoot issues.

Uptrace comes with an intuitive query builder, rich dashboards, alerting rules, notifications, and integrations for most languages and frameworks.
Uptrace can process billions of spans and metrics on a single server and allows you to monitor your applications at 10x lower cost.
In just a few minutes, you can try Uptrace by visiting the cloud demo (no login required) or running it locally with Docker. The source code is available on GitHub.
Prometheus
You can send OpenTelemetry metrics to Prometheus using OpenTelemetry Prometheus exporter.